
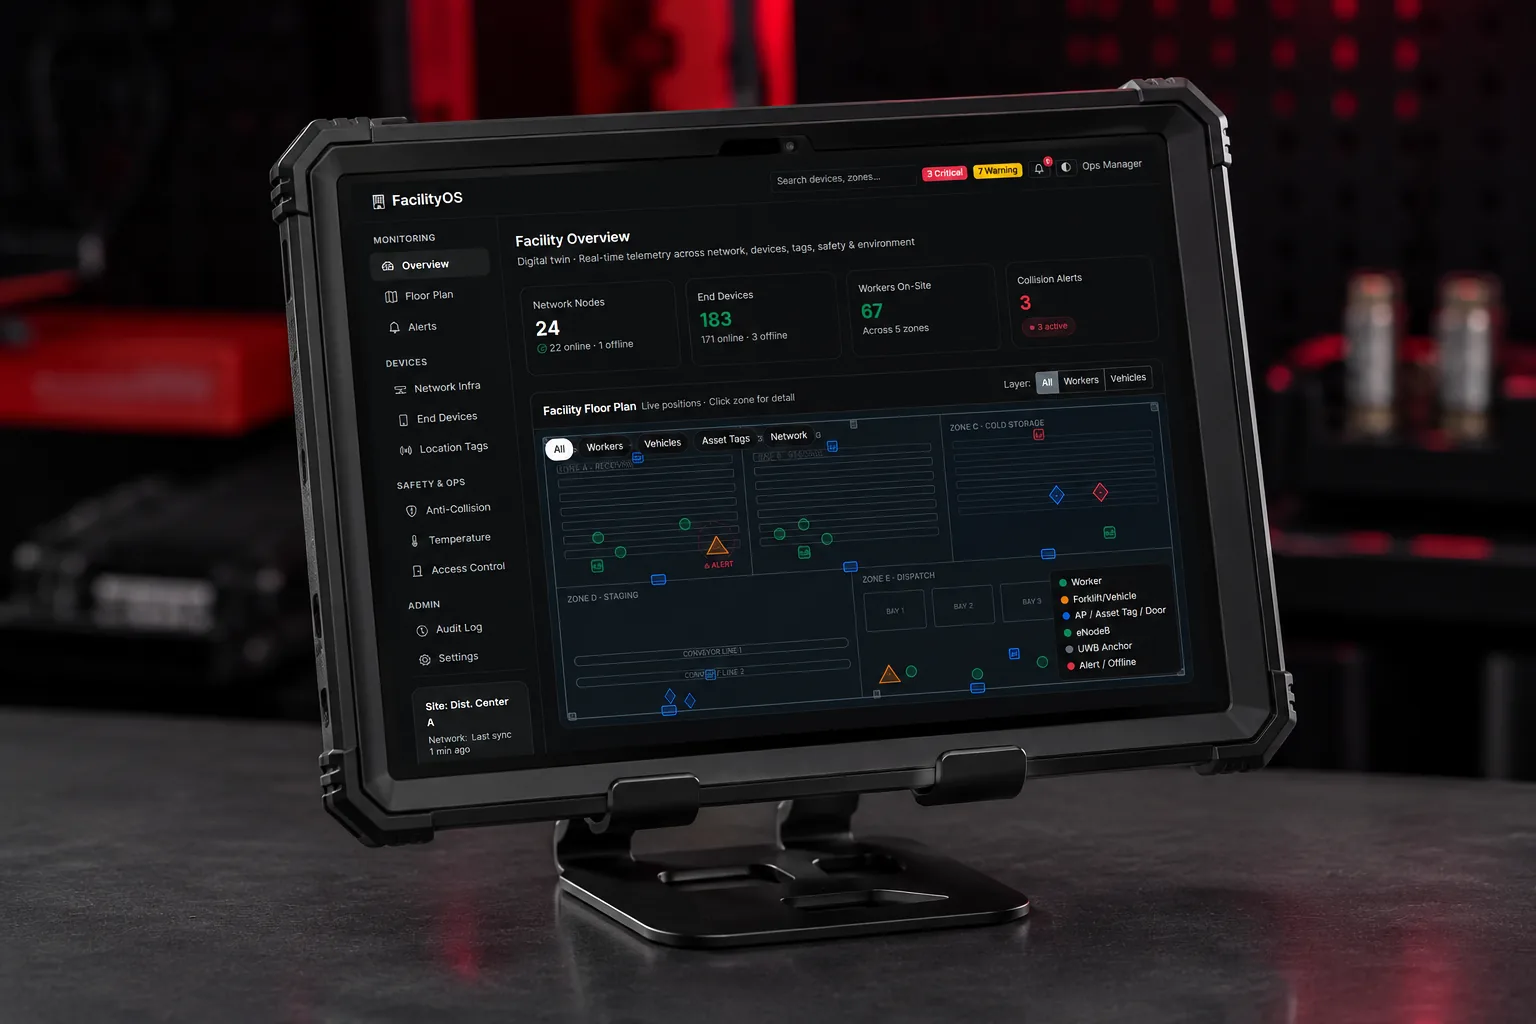
Your operation, live — and reading itself.
A working digital twin puts your whole floor on one pane of glass. AI insights turn that live picture into foresight — flagging collision risk, congestion, and cold-chain drift before they cost you.
Current status, visible the moment it changes.
Not a dashboard bolted onto someone else's hardware, and not a static 3D rendering — a real, working digital twin of your facility. Every layer of the operation, integrated and connected, visible and analyzable in one place, in real time. Here's what that actually puts in front of you.
Where every worker is
Every worker-worn UWB tag reports its position continuously — indoors through the racking and outdoors across the yard, where Wi-Fi and GPS both struggle. That live map drives faster emergency response and mustering, evidence-based labor balancing across zones and shifts, and a one-glance answer to "who's near this job right now" — without anyone calling around on the radio.
Where every forklift is
Each vehicle is located in real time, with speed, dwell time, and how hard it's actually utilized. Instead of guessing at traffic and fleet size, you see the real flow — which trucks sit idle, which routes choke, and whether you're running too many or too few — and right-size the fleet with data instead of intuition.
Which areas are being accessed
Restricted, hazardous, and controlled zones become live boundaries, not signs people ignore. The twin shows exactly who has entered a cold room, a charging area, a high-rack aisle, or a regulated space — and alerts the moment access rules are broken — so enforcement is automatic and every entry is logged for the record.
Temperatures across the facility
Every ambient, refrigerated, and frozen zone reports continuously, building a live thermal picture of the whole building. Threshold alerts fire while a drift is still recoverable — before it becomes spoiled product or a failed shipment — and every reading is retained as an audit-ready log that answers GDP, GMP, and 21 CFR Part 11 questions without a scramble through spreadsheets.
High-traffic zones
Accumulated movement becomes heatmaps of where people and forklifts concentrate and cross. Those patterns expose the real bottlenecks and the corners where pedestrians and vehicles keep meeting — so you can redesign flow, retime tasks, and aim safety effort at the spots that actually carry the risk, backed by evidence instead of anecdote.
Down to one item on a pallet
When the use case justifies it, resolution goes all the way down to the individual unit — not just which aisle or which pallet, but exactly where a single item sits. That's the difference between "it's somewhere in receiving" and a precise location a picker, an audit, or a recall can act on immediately.
Once the twin is live, the AI starts earning its keep.
The digital twin is the data — every worker, forklift, zone, and sensor on one live model. AI insights are what you do with it: not another dashboard to hunt through, but a continuous read on what to act on right now — before it becomes an incident. On a real deployment these run on your live floor; the demo below is simulated.
Predictive collision risk
Instead of only reacting to a near-miss, the model watches how people and forklifts move and flags the corners, aisles, and shift patterns where a conflict is building — so you can fix the layout or the routing before someone gets hurt.
Congestion & traffic forecasting
Traffic heat over time becomes prediction: which dock doors, pick faces, and intersections are about to back up, and when. You staff and stage around the peaks instead of discovering them in the moment.
Cold-chain anomaly detection
Continuous environmental telemetry lets the AI catch temperature drift and the early shape of an excursion — tied to the exact zone, door, and inventory affected — long before a threshold alarm or an audit question.
Ask your floor
Because the twin holds live location and context, you can query it in plain language — "where is pallet 4471," "which zones are over capacity," "show me every forklift idle more than ten minutes" — and get an answer off the floor, not out of a spreadsheet.
See it live, on one pane of glass.
A top-down view of a single facility with every worker and forklift located in real time, zones and temperatures monitored, and traffic mapped. Toggle the layers, click anything on the floor, and watch the event feed. Simulated data — your real twin is built from your floor, your devices, and your network.
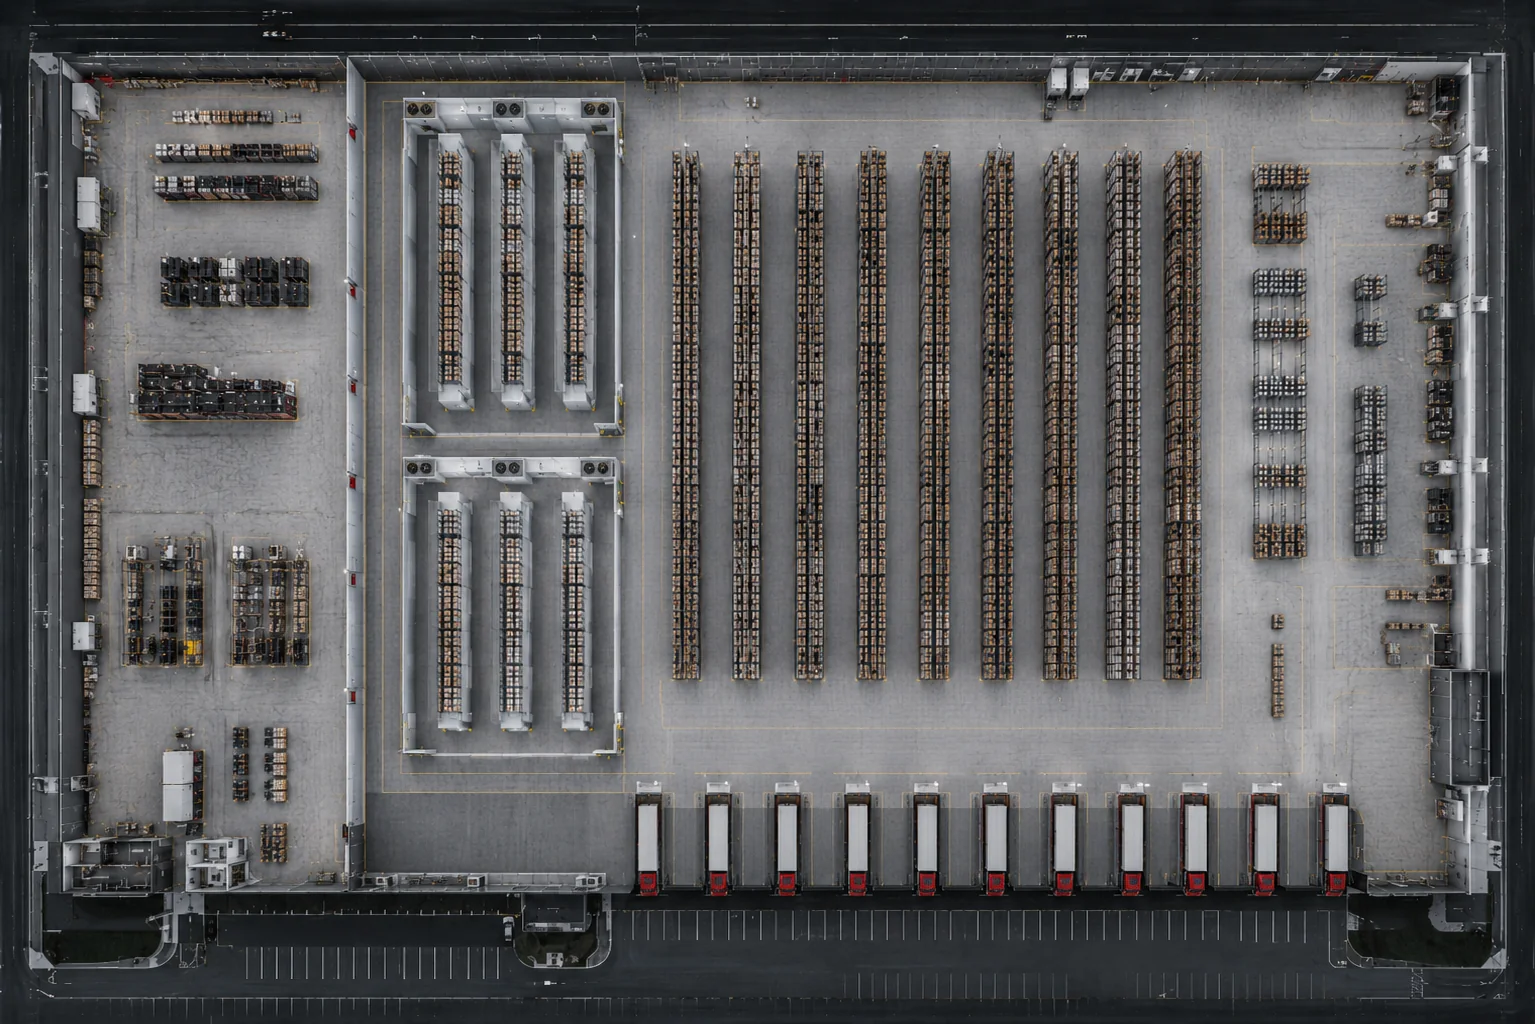
This is a mockup. Yours would be built from your floor.
Every facility is different — the racking, the cold rooms, the yard, the traffic. We build the use cases, devices, and network that make a twin like this real for your operation.